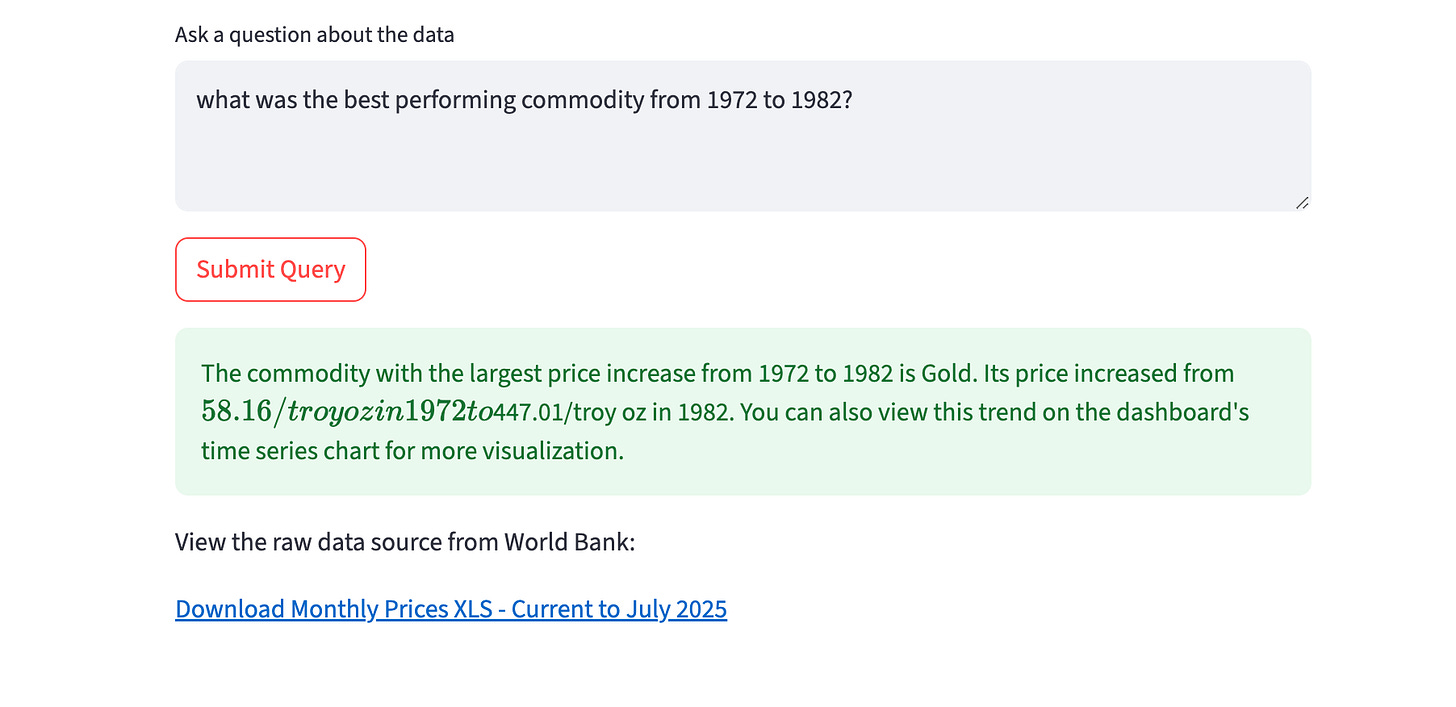
It’s not pretty, but it’s useful.
I built a tool that lets you choose any starting year back to 1960, pick a commodity (or a bunch), and see how that investment would’ve performed — total return, CAGR, and dollar value today. It also lets you ask natural language questions about the data and includes price history, seasonality and relative strength charts as well as a correlation heatmap—we’re comparing everything from lithium to lamb.
This project started with a basic goal: I wanted to get some hands-on experience preparing data for analysis and using vector databases in a Retrieval-Augmented Generation (RAG) system.
Along the way, I cleaned up a 60-year historical price sheet that was unusable, added S&P500 price data and now it’s a clean CSV. If you're working with commodity prices, it's yours.
The secondary goal was to compare how different commodities and the S&P 500 performed over various time periods. I thought I would just be confirming my bias that gold outperforms everything. Instead I found, far more interestingly, that coffee and the S&P 500 are highly uncorrelated. So, if you're looking for a potential hedge during the next downturn, maybe stock up on coffee beans—I suggest Guatemalan from the Atitlan region. 🤌☕
The Stack
Building this dashboard involved several key technologies:
Pandas: This was our workhorse for data manipulation and cleaning. Raw historical price data is rarely perfect, so Pandas was essential for transforming it into a usable format.
Streamlit: We used Streamlit to build the interactive web dashboard. It allowed us to quickly turn our data and analysis into a user-friendly application without getting bogged down in complex web development.
Pinecone: The cloud-based vector database that saved this project (more on that below)
OpenAI's LLMs: The natural language Q&A feature is powered by OpenAI's models. We used
text-embedding-ada-002to convert text into numerical vectors (embeddings) andgpt-4for generating intelligent, context-aware answers.
The Process
Data Preparation and Indexing
I took the raw commodity price CSV and thoroughly cleaned it using Pandas. This involved handling missing values, converting data types, and standardizing formats.
For the Q&A feature, I chunked this historical data. For each commodity, I created text snippets summarizing its prices over different decades (e.g., "Gold prices in the 1970s: 1970: $XX.XX, 1971: $YY.YY,..."). These text chunks were then converted into high-dimensional vectors (embeddings) using OpenAI's text-embedding-3-small.
These embeddings, along with their original text content, were then stored in a vector database.
The Vector Database Pivot
Initially, I was using ChromaDB because it's “easy” to set up locally. However, I ran into a specific issue on my local machine that prevented me from moving forward. Sometimes, you just need to switch tools to get the job done.
So, I pivoted to Pinecone, a cloud-native vector database that provides more robustness than necessary for this project but this change allowed me to get around the block with my local machine, move compute to the cloud, and continue building the dashboard.
Retrieval-Augmented Generation (RAG)
The natural language Q&A works thanks to a RAG architecture:
User Query: You type a question into the dashboard.
Embedding & Search: Your question is immediately converted into a vector. Pinecone then efficiently searches its index to find the most semantically relevant data chunks (the decade-specific commodity price snippets) based on this vector.
Contextual Prompting: The retrieved text chunks are then sent to the
gpt-4LLM as context. This is crucial because it gives the LLM specific information from the dataset to work with, beyond its general training data.Informed Response: The LLM generates an answer based on its general knowledge and the provided context. A key part of the setup was instructing the LLM (via its system message) that it's part of a dashboard that already performs calculations like correlation. This prevents it from telling you it can't calculate something that's already visualized.
What It's For
This project evolved into a practical tool for commodity analysis. I was aiming for some practice with data, but now I have an analysis tool that I’m actually using.
Track Historical Performance: See what hypothetical investments would be worth today.
Analyze Relationships: Use correlation heatmaps to understand how commodities move together.
Identify Seasonal Trends: Discover recurring monthly patterns in prices.
Compare Relative Strength: Gauge one commodity's performance against a benchmark you choose.
Ask Natural Language Questions: Get direct, context-aware answers about the data by simply asking.
Use the data. Break the tool. Fork it into something better. I made it to practice — but it's surprisingly useful.
Try the Commodity Dashbaord here:
Live App → [Click Here]
Code & CSV → [Github repo]
Stay blessed
<3
Derek


